Much emphasis is placed on the creation of full time jobs in Tasmania, but the reality is that the growth in employment since data collection began in 1978 has been in part time employment (or less than full time - 35 hours per week).
In the 15 years since 1998, part time employment in Tasmania has increased by 37.8 per cent, compared with 8.5 per cent for full time employment (overall jobs growth of 15.3 per cent).
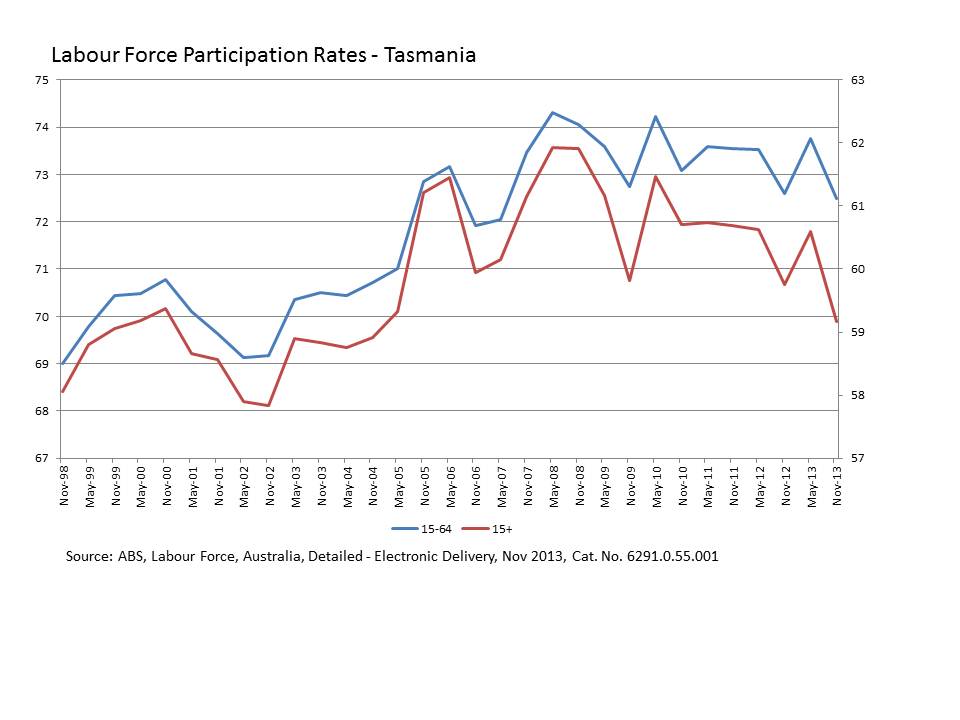
There are a number of reasons explaining this increase in part time employment. First, the considerable increase in female labour force participation rates (increased from 39.9 percentage points in February 1978 to 55 percentage points in December 2013). Compared with men, a higher proportion of women are employed on a less than full time basis, particularly those who combine paid work with the role of raising a family. Second, structural change in Tasmania's industry sector base combined with an ageing population, has resulted in growth in services sectors such as health and community care and education. These sectors are traditionally feminised workplaces and thus have a higher prevalence of part time employment. Third, recent efforts in job creation have focused on industry sectors which have a higher proportion of employment in less than full time work such as tourism and retail.
Important to recognise however, is that part time employment is not necessarily a bad thing. In fact, the availability of part time and flexible work has the potential to increase labour force participation for both men and women in all age groups.
In the 15 years since 1998, part time employment in Tasmania has increased by 37.8 per cent, compared with 8.5 per cent for full time employment (overall jobs growth of 15.3 per cent).
There are a number of reasons explaining this increase in part time employment. First, the considerable increase in female labour force participation rates (increased from 39.9 percentage points in February 1978 to 55 percentage points in December 2013). Compared with men, a higher proportion of women are employed on a less than full time basis, particularly those who combine paid work with the role of raising a family. Second, structural change in Tasmania's industry sector base combined with an ageing population, has resulted in growth in services sectors such as health and community care and education. These sectors are traditionally feminised workplaces and thus have a higher prevalence of part time employment. Third, recent efforts in job creation have focused on industry sectors which have a higher proportion of employment in less than full time work such as tourism and retail.
Important to recognise however, is that part time employment is not necessarily a bad thing. In fact, the availability of part time and flexible work has the potential to increase labour force participation for both men and women in all age groups.
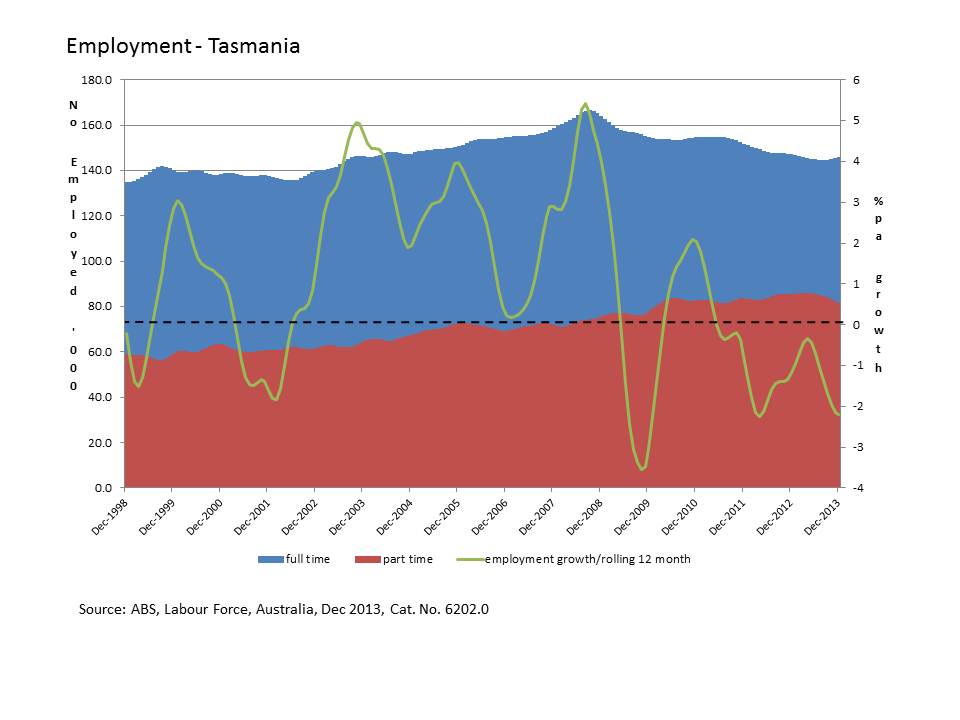
Job creation, whether it be full or part time work, is of critical importance for Tasmania, economically and socially. However, as evident in the above chart, employment growth in the state has been volatile at best. Since the GFC in 2009 which resulted in a contraction of employment of nearly 4 per cent, the only period of growth in employment occurred in 2010 and was supported by Federal Government economic stimulus packages such as the building the education revolution and nation building infrastructure. Since then, employment in Tasmania has continued to contract.
Importantly, future job creation is likely to continue to be dominated by less than full time employment, influenced by increasing female labour force participation, maintaining labour force attachment of older workers through policy strategies such as transitioning to retirement and the increasing trend of men working part time as they 'share the care' of raising families with their partners.
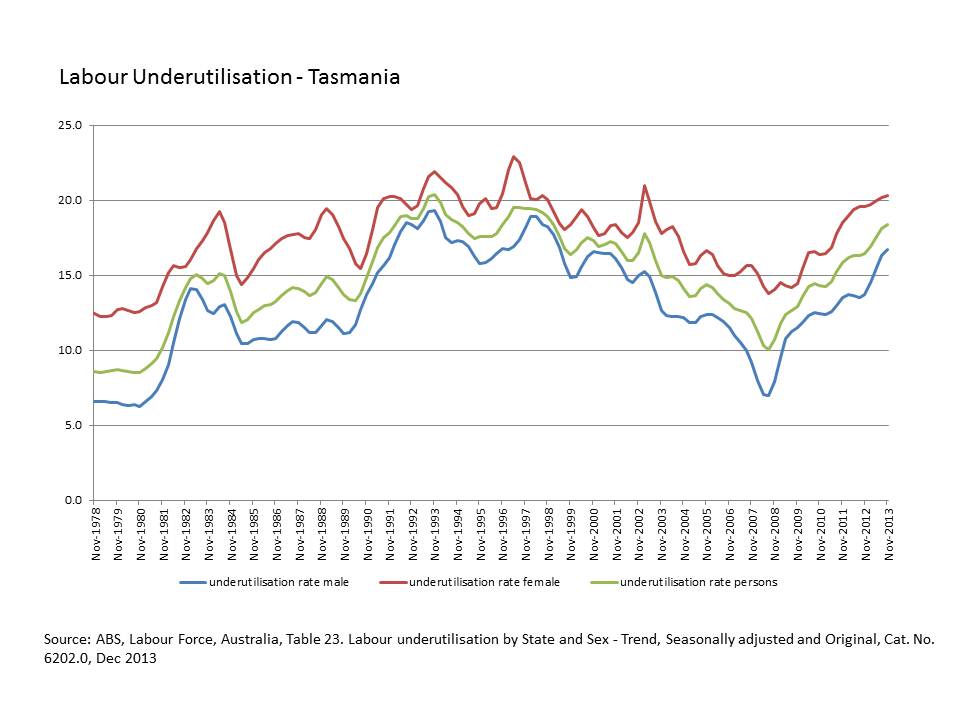
As this trend continues, the number of jobs created will become less important, and the productivity of those employed will become more important. Productivity can be measured in a number of ways, but when assessing from an employment to population perspective, labour underutilisation provides a significant insight into the true state of the employment market. Labour underutilisation is the sum of those unemployed and those underemployed (that is those who have a job but are working less hours than they would like to and are able to).
So while part time employment is desirable for many people and can facilitate increases in labour force participation, if people are not working as many hours as they would like to, they are not being utilised effectively. As is evident in the below chart, labour underutilisation is significant in Tasmania and trending upwards with over 20 per cent of women and 17 per cent of men underutilised in the labour market. Underemployment masks the true nature of the employment market in Tasmania.
Any analysis of job creation and employment growth in Tasmania and its contribution to the economy must also consider labour utilisation.
Importantly, future job creation is likely to continue to be dominated by less than full time employment, influenced by increasing female labour force participation, maintaining labour force attachment of older workers through policy strategies such as transitioning to retirement and the increasing trend of men working part time as they 'share the care' of raising families with their partners.
As this trend continues, the number of jobs created will become less important, and the productivity of those employed will become more important. Productivity can be measured in a number of ways, but when assessing from an employment to population perspective, labour underutilisation provides a significant insight into the true state of the employment market. Labour underutilisation is the sum of those unemployed and those underemployed (that is those who have a job but are working less hours than they would like to and are able to).
So while part time employment is desirable for many people and can facilitate increases in labour force participation, if people are not working as many hours as they would like to, they are not being utilised effectively. As is evident in the below chart, labour underutilisation is significant in Tasmania and trending upwards with over 20 per cent of women and 17 per cent of men underutilised in the labour market. Underemployment masks the true nature of the employment market in Tasmania.
Any analysis of job creation and employment growth in Tasmania and its contribution to the economy must also consider labour utilisation.