In his State of the State address last month the Premier stated that “Tasmania is around ten per cent less productive than the rest of the country” and linked his assertion to the lower educational attainment of Tasmanians compared with our interstate counterparts. That is only part of the story. Educational attainment does not automatically transfer into productivity – it is how this knowledge and skill is utilised in the workplace which contributes to productivity and potential gains.
Productivity is a measure of the relationship between inputs and outputs. In terms of labour productivity - which is linked to educational attainment - the input is the hours worked and output is the value of Gross State Product (GSP). I calculate the differential between Tasmania’s labour productivity and Australia’s labour productivity to be closer to 19 per cent. This differential has increased from 15 per cent the previous year (2012/13)
Based on FY2013/14 State Accounts data released by the ABS last week, for every hour worked in Tasmania, around $724 was generated in GSP, compared with $863 GDP for every hour worked in Australia.
Productivity is further reflective of the respective industry composition, with some sectors more productive than others. Generally, lower skill, lower wage and labour intensive industries have lower levels of productivity compared with higher skill and less labour intensive industry sectors. Overall measures of productivity are further influenced by the proportionate contribution of each sector to the state’s GSP.
Essentially, Tasmania performs relatively poorly in terms of productivity as a result of it's industry composition. Exacerbating this is that sectoral productivity also performs poorly compared with the national rate for most industries (14 out of 19 sectors).
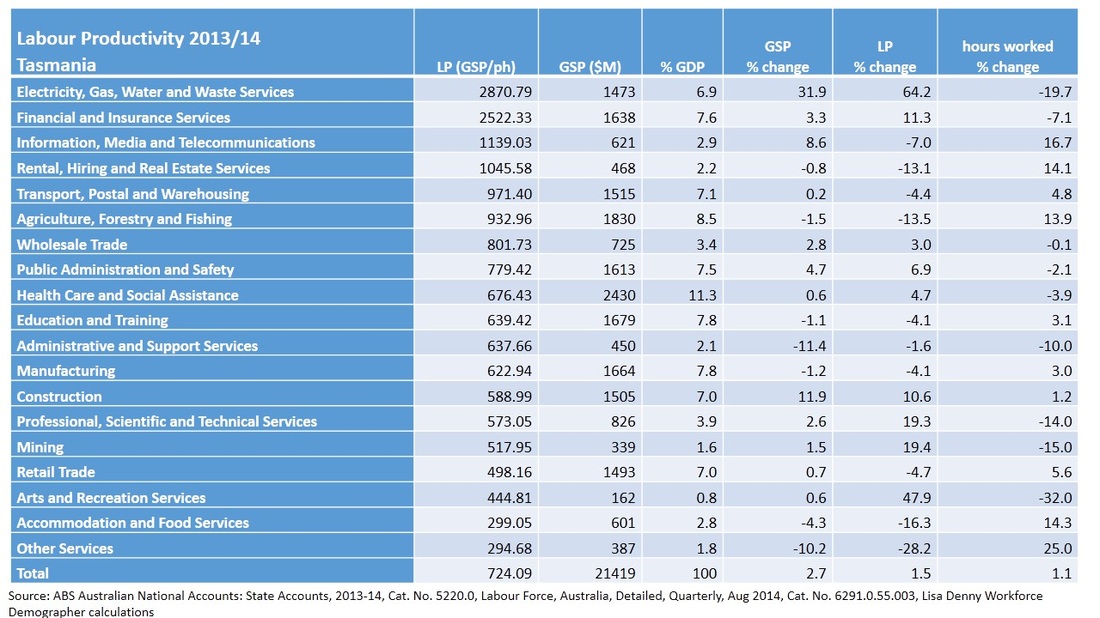
Tasmania’s most productive sectors are Electricity, Gas, Water and Waste Services, Financial and Insurance Services and Information, Media and Telecommunications, each increasing their contribution to GSP from 2012/13 to 2013/14, however labour productivity in the Information, Media and Telecommunications sectors decreased over the same time.
Tasmania’s least productive sectors are Other Services, Accommodation and Food Services and Arts and Recreation Services. Both Other Services and Accommodation Services experienced a decline in labour productivity and contribution to GSP compared with the previous year, despite an increase in the number of hours worked.
The table below illustrates the comparative performance of each industry sector in 2013/14 in terms of labour productivity, GSP, proportionate contribution to GSP, and the change in labour productivity, GSP and hours worked compared with the previous year (2012/13). The sectors are listed from the most productive to the least productive.
Productivity is a measure of the relationship between inputs and outputs. In terms of labour productivity - which is linked to educational attainment - the input is the hours worked and output is the value of Gross State Product (GSP). I calculate the differential between Tasmania’s labour productivity and Australia’s labour productivity to be closer to 19 per cent. This differential has increased from 15 per cent the previous year (2012/13)
Based on FY2013/14 State Accounts data released by the ABS last week, for every hour worked in Tasmania, around $724 was generated in GSP, compared with $863 GDP for every hour worked in Australia.
Productivity is further reflective of the respective industry composition, with some sectors more productive than others. Generally, lower skill, lower wage and labour intensive industries have lower levels of productivity compared with higher skill and less labour intensive industry sectors. Overall measures of productivity are further influenced by the proportionate contribution of each sector to the state’s GSP.
Essentially, Tasmania performs relatively poorly in terms of productivity as a result of it's industry composition. Exacerbating this is that sectoral productivity also performs poorly compared with the national rate for most industries (14 out of 19 sectors).
Tasmania’s most productive sectors are Electricity, Gas, Water and Waste Services, Financial and Insurance Services and Information, Media and Telecommunications, each increasing their contribution to GSP from 2012/13 to 2013/14, however labour productivity in the Information, Media and Telecommunications sectors decreased over the same time.
Tasmania’s least productive sectors are Other Services, Accommodation and Food Services and Arts and Recreation Services. Both Other Services and Accommodation Services experienced a decline in labour productivity and contribution to GSP compared with the previous year, despite an increase in the number of hours worked.
The table below illustrates the comparative performance of each industry sector in 2013/14 in terms of labour productivity, GSP, proportionate contribution to GSP, and the change in labour productivity, GSP and hours worked compared with the previous year (2012/13). The sectors are listed from the most productive to the least productive.
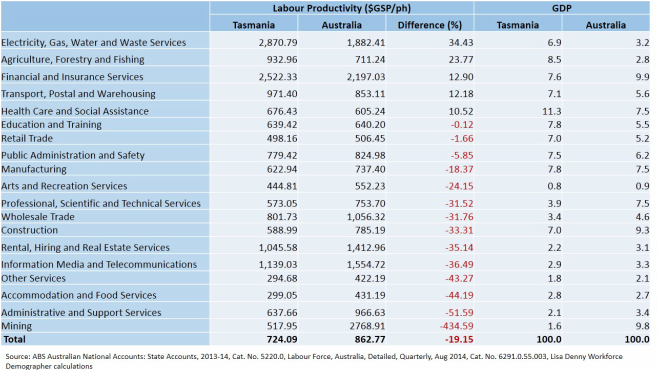
In terms of comparison with Australia, while overall productivity is lower than the national average, this differs considerably by sector and contribution to GSP (GDP). Of the 19 sectors, Tasmania is more productive than the national average in five. The table below shows Tasmania's industry sectors relative performance in terms of both labour productivity and contribution to GSP. The sectors in which Tasmania performs comparatively worse are highlighted in red. Tasmania is around 34 per cent more productive in the Electricity, Gas, Water and Waste Services sector than Australia and 24 per cent more productive in Agriculture, Forestry and Fishing. Both of these sectors also contribute a greater proportion to GSP than the national average. Sectors which perform comparatively worse than the national productivity rates include Mining (-435 per cent) Administrative and Support Services (-51.6 per cent) and Accommodation and Food Services (-44.2 per cent).
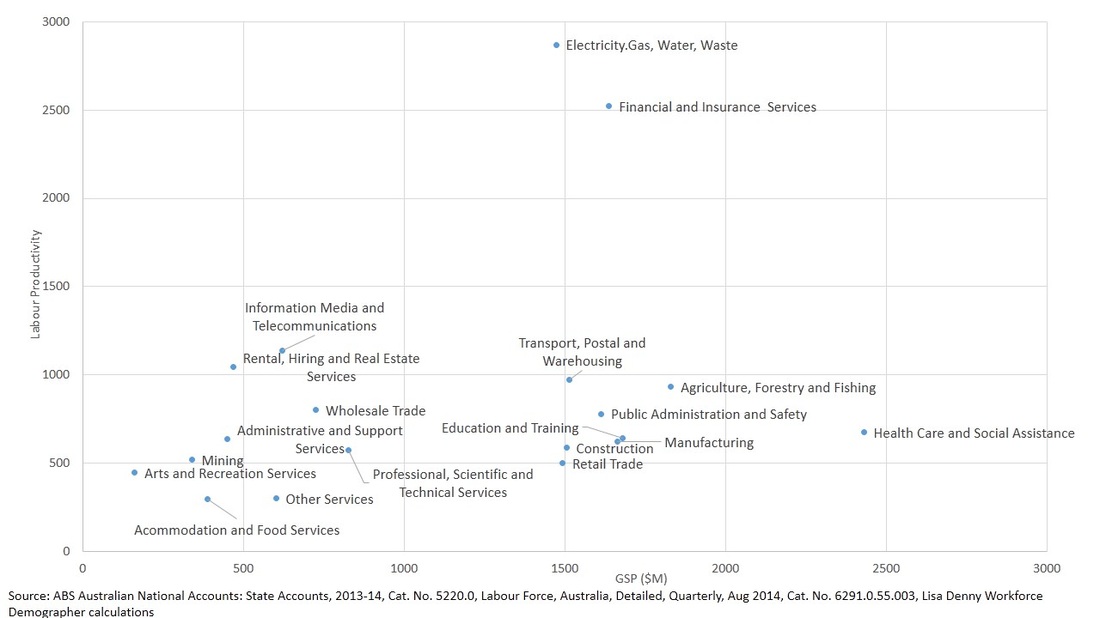
The Labour Productivity Matrix below plots industry sector labour productivity and GSP contribution which enables a comparative analysis of the performance of each sector.
If Tasmania is to improve its overall productivity performance it needs to do two things.
1) Grow the sectors which have higher levels of productivity
2) Improve the comparative performance of individual sectors with the national average
Tasmania needs to focus on increasing the 3Cs - increasing competitiveness, capability (skills) and capacity (volume) in key sectors to get them on the trajectory to the top, right quadrangle. These key sectors include Agriculture, Forestry and Fishing, Manufacturing and Information, Media and Telecommunications.
Increasing educational attainment will play a part in increasing productivity performance, however, this is a supply side policy approach only. Critical to improving productivity is growth in demand. Put simply, if job creation is disproportionately in low skilled, low wage, labour intensive industries, then productivity growth will decline in relative Tasmanian terms and the gap will widen nationally, as it has over previous years.