Yesterday the Australian Bureau of Statistics released new regional migration data estimating both interstate and intrastate migration movements within Australia (catalogue 3412.0).
Available data includes arrivals, departures and net movements by age and sex for various sub-state geographies (SA3, SA4 and LGA) for the years ending 30 June 2006/07 to 2013/14.
The new data provides for much greater insight and understanding of population movements in smaller areas than previously possible. This can be used to inform planning, provision of services (e.g. child care, schools, aged care, public transport etc) and investment in infrastructure (roads, community amenities, communications technology etc) much more effectively.
There is much that can be done with this data, so I just provide a quick snapshot using three different data sets.
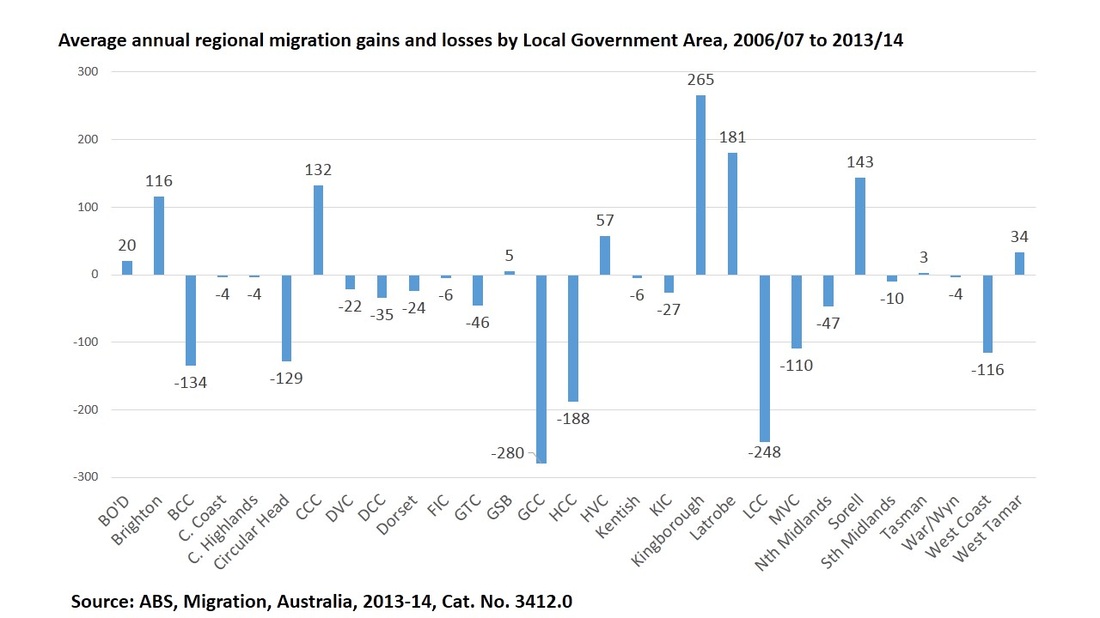
The first data set provides estimates of arrivals, departures and net migration movements by local government area (LGA) for the 8 years from 2006/07 to 2013/14. The below figure shows the average annual net gains or losses for each LGA. The Glenorchy, Launceston and Hobart municipalities recorded the greatest average migration losses while the Kingborough, Latrobe and Sorell municipalities recorded the greatest average gains. This data is also available at the SA2 level, but given there are 98 SA2s, I have not presented the data here. However, this data would be particularly useful for local councils to gain a greater understanding of change within smaller areas of their municipalities.
Available data includes arrivals, departures and net movements by age and sex for various sub-state geographies (SA3, SA4 and LGA) for the years ending 30 June 2006/07 to 2013/14.
The new data provides for much greater insight and understanding of population movements in smaller areas than previously possible. This can be used to inform planning, provision of services (e.g. child care, schools, aged care, public transport etc) and investment in infrastructure (roads, community amenities, communications technology etc) much more effectively.
There is much that can be done with this data, so I just provide a quick snapshot using three different data sets.
The first data set provides estimates of arrivals, departures and net migration movements by local government area (LGA) for the 8 years from 2006/07 to 2013/14. The below figure shows the average annual net gains or losses for each LGA. The Glenorchy, Launceston and Hobart municipalities recorded the greatest average migration losses while the Kingborough, Latrobe and Sorell municipalities recorded the greatest average gains. This data is also available at the SA2 level, but given there are 98 SA2s, I have not presented the data here. However, this data would be particularly useful for local councils to gain a greater understanding of change within smaller areas of their municipalities.
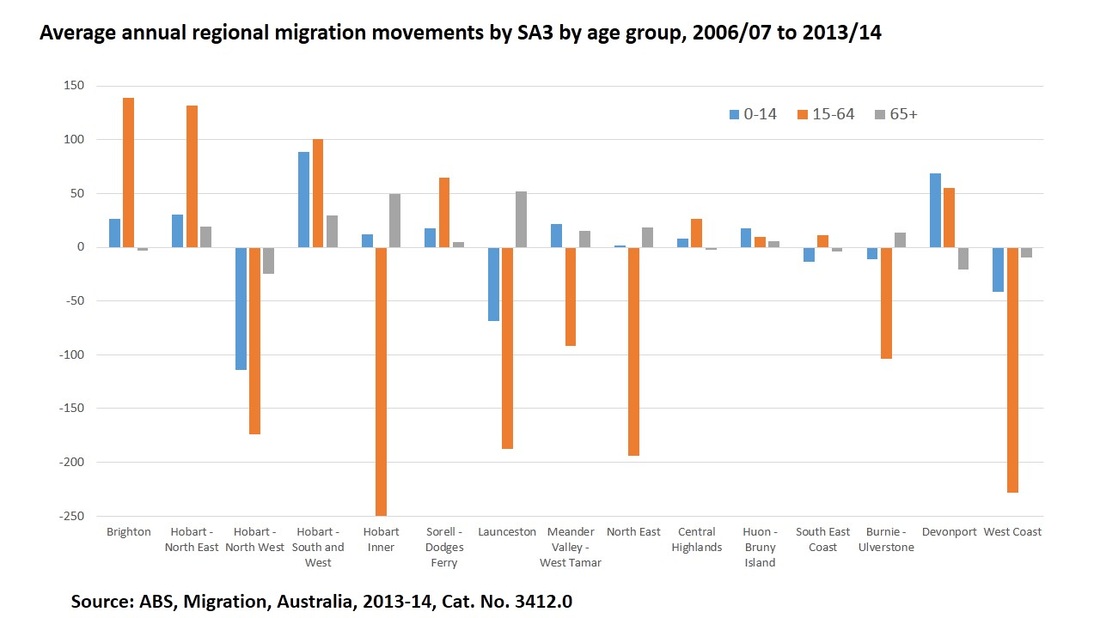
The second data set provides estimates of net migration movements by age at the SA3 geographical classification level. This data is particularly useful in understanding the changes in the age profile of the region and how it may impact on service provision in the area. It can also provide an indication of the rate of ageing and potential for growth/decline in the area. I have aggregated the data into 0 to 14 years, working age (15 to 64 years) and 65 and older. As is evident in the figure below few areas experienced average gains in all age groups. Gains in those aged 0 to 14 will contribute to making the area younger, while comparative gains in those aged 65 and older will contribute to the ageing of the population at a greater rate. Large changes in the working age group impacts on the potential supply of labour and the ability to service the needs of the area, particularly in areas beyond an acceptable commuting distance.
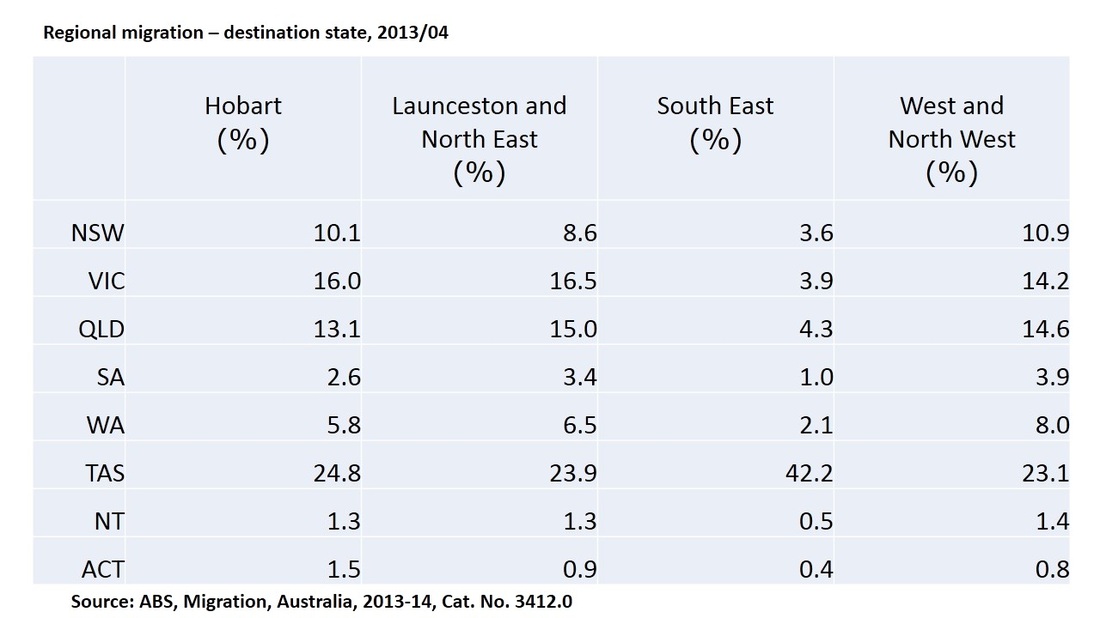
The final data set for this snapshot is the migration by region of arrival and departure. As the table below shows, for 2013/14, almost a quarter of all regional migration movements out of the Hobart, Launceston and North East or the West and North West regions of Tasmania remain in Tasmania. The eastern seaboard states of New South Wales, Victoria and Queensland attract the majority of the other migration movements.
It is likely that the Australian Population Association (APA) will run some half day courses on using and understanding demographic data in Tasmania in the near future. If you are interested in attending a course, please express interest to me via email lisa at lisadenny.com.au. I will be able to provide further information when it becomes available.