Last week at the CEDA Economic and Political Outlook for Tasmania Ivan Colhoun, Chief Economist at the ANZ Bank, suggested that the unemployment rate is the cheat's guide to providing an indicator of economic performance. Given slight improvements in Tasmania's unemployment rate in recent months I thought I would revisit an article I wrote in October 2011 for tasmanianjobs.com at a time when there were also "encouraging signs that our economy is on the road to recovery". My article concluded then that the unemployment rate and the labour force participation rate demonstrated the potential for a downward spiral to continue. My recommendations then was that we were at a point in time in the economy that we needed stability and direction to enable an increase in confidence (see the October 2011 article here).
So, this morning I have updated the data from that article, and unfortunately I was right - the downward spiral of increasing unemployment rates and decreasing labour force participation rates continued. See the below chart.
So, this morning I have updated the data from that article, and unfortunately I was right - the downward spiral of increasing unemployment rates and decreasing labour force participation rates continued. See the below chart.
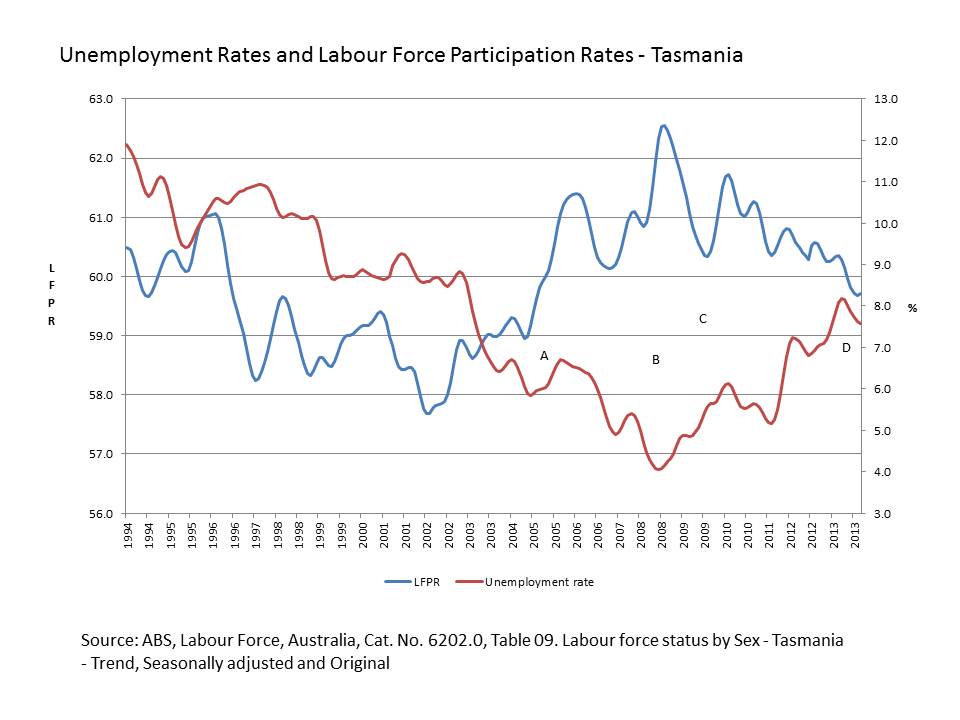
I recap how to interpret this chart. The gap between the two lines can be interpreted to represent the strength and confidence in the economy at a point in time. The greater the distance in the gap between the two lines, the stronger the economy as more people are confident of participating in the labour market and less people are unemployed. When the lines move together in an upward trajectory, labour force participation and unemployment are both increasing, indicating that there is confidence in gaining employment but there is a short time lapse between entering the labour market and securing employment (Point A). This pattern tends to be a very short lived one as employment catches up to supply. When the lines move in different directions and the labour force participation rate is increasing and unemployment decreasing (Point B) it indicates that the supply of labour (new entrants to the labour market) can not keep up with the demand for labour. Conversely, when the labour force participation rate is decreasing and the unemployment rate is increasing (Point C), there is a lack of confidence, people are losing their jobs and joining the unemployed status. This may result in the unemployed eventually becoming despondent and exiting the labour market all together. This occurs when both lines move in a downward trajectory (Point D) - that is labour force participation and unemployment are both decreasing. This could be for a number of reasons; either a lack of confidence and growing despondency in the ability to gain employment or a factor of the age of our population.
So, where is Tasmania now? We are currently just past Point D, experiencing a stablisation of both the labour force participation rate and the unemployment rate - but both are yet to make an upward movement (as in Point A) - the sign of momentum in a recovering economy. We are in much the same place as we were in October 2011, however the economy didn't recover then as it was anticipated to do.
My advice remains the same as it was then - a need for stability and direction to build confidence. Don't take the foot off the pedal and don't count the chickens before they hatch.