Dr Lisa Denny: Demographer
  • Home
  • About Lisa
  • Publications + Presentations
  • Contract Research
  • OpEds

What the birth data means for population growth in Tasmania

25/10/2013

0 Comments

 
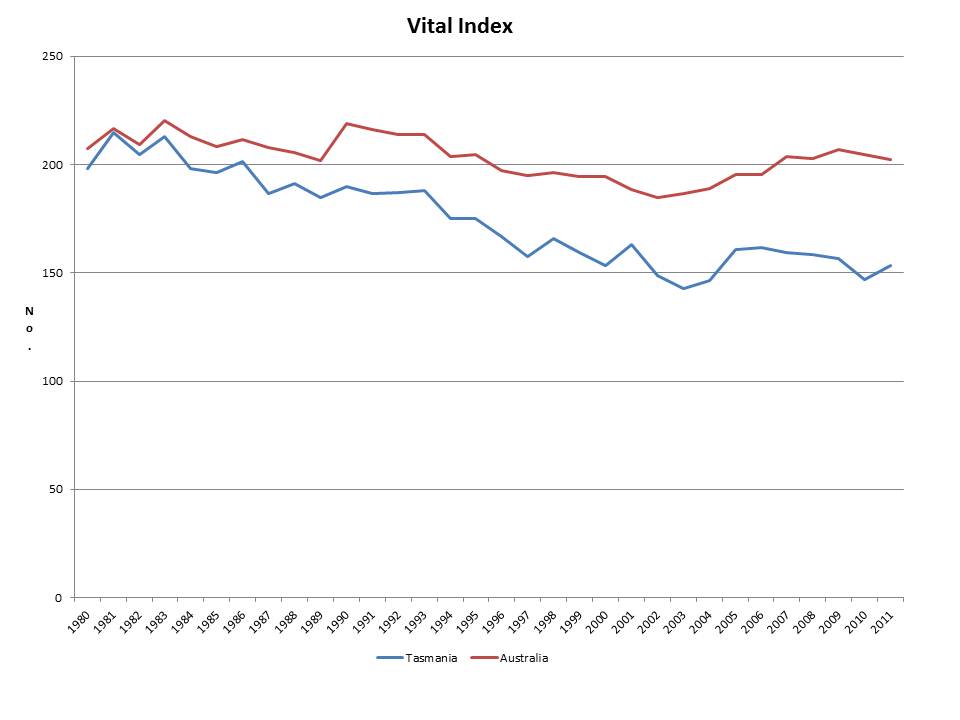
Yesterday's release of birth data by the ABS showed a clear indication that the propensity for population growth in Tasmania is declining.

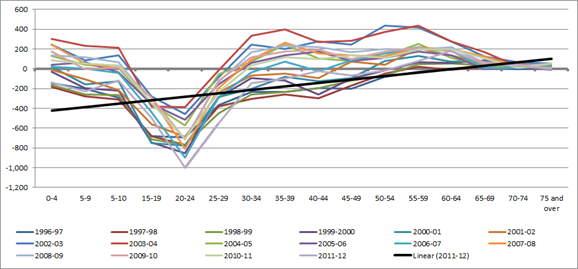
The two correlates for population growth are the size of the reproductive cohort and economic performance. In Tasmania, both of these correlates have a direct relationship with net interstate migration (NIM).

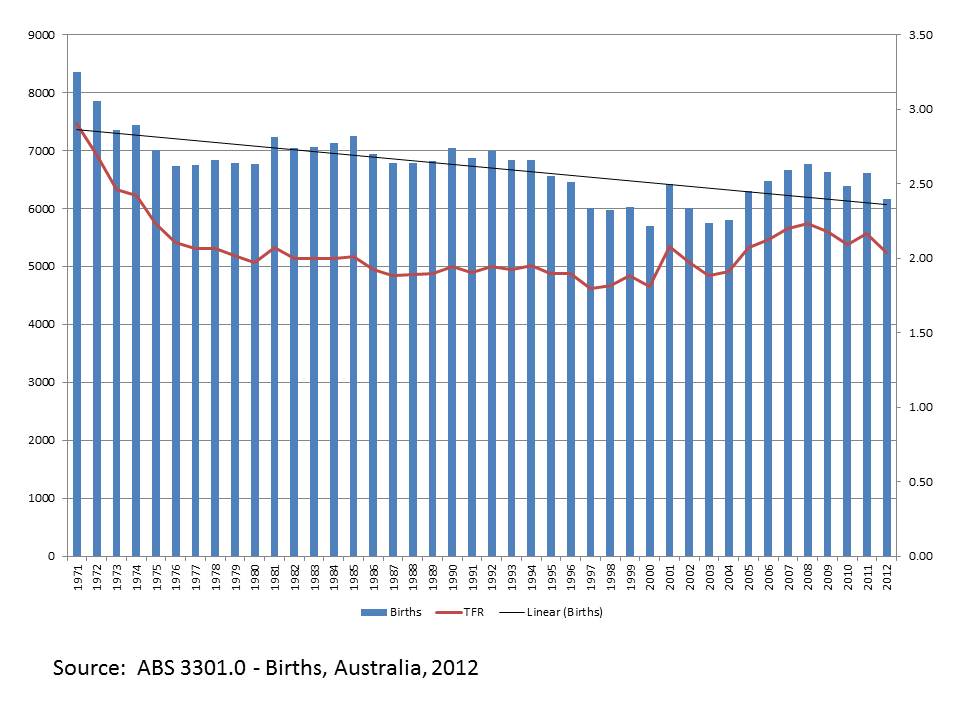
For the 2012 year, births in Tasmania decreased to 6168 (from a high in 2007 of 6775) and the Total Fertility Rate (TFR) dropped to 2.04, below replacement rate (the NT is now the highest at 2.21).  All other states and territories, apart from NSW, recorded an increase in both the number of births and the TFR. 

The drop in births is directly attributable to the declining size of the reproductive cohort as a result of NIM movements.  Furthermore, it directly impacts on Tasmania's propensity for population growth over both the short and longer term. 
Picture
0 Comments

why population projections can be misleading

2/9/2013

0 Comments

 
Tasmania's Department of Treasury and Finance recently released their population projections for Tasmania, projecting that under the medium series, Tasmania's population will grow by 78,000 people in the next 50 years. 

Population projections are not forecasts, they are projections based on a combination of assumptions in relation to fertility rates, mortality (life expectancy) rates and migration (both interstate and international).  These assumptions are usually based on historical trends. 

The accuracy of population projections is dependent on the method employed.  This is particularly important in Tasmania's case.  The changes in Tasmania's population do not follow 'normal' patterns compared with Australia or other Australian states and therefore projections are very difficult to undertake. 

Since 1981, Tasmania's population has grown by around 85,000 people - a growth of almost 20 per cent, or 0.7 per annum (see below chart).  This growth occurred for a number of reasons.  The reasons also contribute to why this rate of growth is unlikely to continue.  The growth was primarily driven by natural increase (more births than deaths) which resulted from the large cohort of baby boomers (those born 1945 to 1965) reaching reproduction age.  Population growth was complemented by increases in interstate and international migration during periods of economic growth.

Tasmania's current and future population is highly influenced by the potential for reproduction and the age of migrants.  While fertility rates may remain around replacement level (2.1 births per woman over her lifetime), the actual number of births achieved is dependent upon the size of the reproductive cohort (i.e. those women of childbearing age).  In Tasmania, this cohort is decreasing in size; due to declining fertility rates since the baby boom and also net migration losses in the childbearing ages. 

The risk in undertaking population projections is not accounting for the size of the reproductive cohort and the migration movements which impact on the size of this cohort.  If current and historic migration trends continue,  the size of the cohort will continue to decline.  Even if the fertility rate remains constant, the actual number of births will decrease. 

In sum, using historical trends to inform future patterns is problematic for all jurisdictions, but particularly so for Tasmania.  This is exacerbated by not accounting for the age of migrants. 
Picture
0 Comments

Tasmania's vital index

23/8/2013

0 Comments

 
The vital index, the annual number of births per 100 deaths, is a simple measure but can often be eye-opening.  In fact, the measure provides a valuable insight into population dynamics.  A population's composition and size (and growth rate) is influenced by the number of births and deaths (the difference being 'natural  increase' (or decline)) and migration.  In Tasmania's case, migration includes both international migration and interstate migration.  

Tasmania's vital index (below chart) is a result of a number of factors: the total fertility rate (TFR) and its historic downward trend (and recent increase); the proportion of the population in the older ages; the number of young people who have moved into childbearing ages; and the effect of immigration, which normally consists of workers and their families who are themselves in the childbearing ages. In Tasmania's case net interstate migration in the childbearing ages has historically been negative, while net international migration in the childbearing ages has been positive.  However, interstate and international migrants have differing fertility patterns. 
Picture
As the Tasmanian population continues to age at a faster rate than the rest of Australia (as a result of interstate migration patterns), it is likely that the state's vital index will continue it's (historic) downward trajectory.  In the event that Tasmania's 'natural increase' becomes 'natural decline', any growth in the size of the population will be dependent on net increases in migration, which also has the potential to reverse the natural decline - subject to the age profile of the migrants. 
0 Comments

February 28th, 2013

28/2/2013

1 Comment

 
Government and business believe that a solution to population ageing, stagnating economic growth and skill shortages is increasing immigration.  In fact, 80 per cent of the population growth projected in the 2010 Intergenerational Report will come from immigration and their yet to be born, highlighting the reliance of government on population growth to stimulate demand.  Opponents to population growth raise concerns to the carrying capacity of the nation which extend to environmental and social consequences.  However, there is another concern, that is, the economic opportunity cost of the current, and projected, high levels of immigration redirecting public monies to city-building infrastructure rather than productivity-enhancing initiatives. 

While immigrants on employment visas (as opposed to humanitarian and family visas) tend to be younger and more educated that the domestic population, there is little evidence that they are meeting the needs of employers in terms of skill shortages in regional and resource boom areas.  Most migrants flock to the metropolitan areas of Sydney and Melbourne, and given the conditions of the visa preventing access to welfare benefits in the first two years of arrival, migrants need to accept any employment offer, often crowding out domestic workers which at times also results in a dampening effect on wages, particularly in a competitive employment market as we are now experiencing.   It is estimated that migration contributes around 100,000 migrants to the workforce every year; however in 2012 only 115,000 jobs were created in Australia.  Not only are migrants not meeting skills shortage requirements, but their mass contribution to population growth not only puts pressure on existing infrastructure and pushes up costs, it creates further skill shortages in non-critical jobs to meet the demands of an increasing population, ‘justifying’ further high levels of immigration.  There is also evidence that the current high immigration and settlement in metropolitan areas is influencing domestic migration and the sea and tree change phenomena, creating similar infrastructure bottlenecks in regional and rural areas as being experienced in cities.  To cater for this increasing demand, governments (federal, state and local) are required to provide the necessary infrastructure and services to support the population (as expected from a first world country).

Given there is not a bottomless bucket of public money to spend, governments must decide how best to direct their revenue to support its population.  For a nation projected to grow from a population of 23 million in 2013 to 36 million in 2050, this spend is currently committed to city-building infrastructure.  This is despite the fact that the Commonwealth Government identifies in the 2010 Intergenerational Report that higher productivity is the key to balancing the needs of a changing demographic. 

Until the government determines the appropriate level of immigration to meet the needs of the current population, public money will be directed to supporting population growth as a result of immigration rather than to productivity-enhancing initiatives, such as information telecommunications, education and training, innovation support, research and development and regulatory reform.   As a consequence, it is likely that Australia will continue to report woeful productivity performance. 

1 Comment

dissecting Tasmania's interstate movements

11/2/2013

1 Comment

 
Tasmania recorded its worst net interstate migration loss in 12 years for the financial year 2011/12, losing 2,552 persons over the 12 month period, compared with 47 the year before and gaining 322 the year before that (2009/10).

From a net migration perspective, Tasmania has historically always experienced a net loss in the younger ages of 15 to 29, seeking education, employment or life experience opportunities.  Historically, the state has always experienced a net gain in the older ages of 45 to 75 and over, contributing to the rate of ageing. However, for the year 2011/12 the state experienced losses in all age groups from 0 to 54 and also, for the third time, a loss in the 75 years and over age group.  This is evident in the below diagram illustrating Net Interstate Migration for Tasmania by age group from 1996/97 until 2011/12.
Picture
It is easy to assume that this significant loss is the result of high levels of Tasmanians leaving the state in search of opportunities elsewhere.  However, this is not the case.  Net migration movements are the difference between arrivals to the state and departures from the state.  The cause of the recent net migration loss is actually a greater decline in the number of arrivals to the state, rather than a significant increase in numbers leaving the state.  Furthermore, while there has been slight increases in the numbers departing for each age group for the past three years, since data collection began in 1996/97 the numbers have been trending downwards for all age groups apart from those 55 to 75 and over (which are comparatively small in number).  However, arrivals to the state have also been trending downwards over this time, again apart from those 55 to 75 and over (which are also comparatively small in number).  This means that there have not been enough arrivals to the state to replace the ones who are leaving.  Interestingly, but not surprisingly, Tasmania experienced its greatest net migration gains from 2002/03 to 2005/06 when arrivals peaked for all age groups and departures were at their lowest, coinciding with the relative economic prosperity the state and nation were experiencing. 

Importantly however, 10,182 people arrived in Tasmania during 2011/12 (compared with a departures of 12,738).  Of these arrivals, the largest group was those aged 25 to 29 (1,156 people or over 10 per cent of the total arrivals), closely followed by those aged 30 to 34 (938 people).  While more people did leave the state in these age group than arrive, it is indicative that young, prime working age people still move to Tasmania, and more do so than in any other age group.

The challenge for Tasmania is to reverse the recent slight increase in the numbers departing the state and maintain arrivals in order to return the state to positive interstate migration movements.  
 

1 Comment

    Archives

    April 2023
    September 2022
    August 2022
    July 2022
    June 2022
    April 2022
    March 2022
    December 2021
    July 2021
    June 2021
    February 2021
    November 2020
    September 2020
    August 2020
    June 2020
    October 2016
    July 2015
    June 2015
    March 2015
    December 2014
    November 2014
    October 2014
    August 2014
    June 2014
    May 2014
    April 2014
    March 2014
    February 2014
    January 2014
    November 2013
    October 2013
    September 2013
    August 2013
    July 2013
    May 2013
    April 2013
    February 2013
    January 2013
    December 2012

    Categories

    All
    Births
    Confidence
    Deaths
    Demography
    Economic Growth
    Economic Performance
    Economics
    Education
    Employment
    Gen Y
    Labour Force
    Leadership
    Migration
    Population
    Population Ageing
    Population Growth
    Pride
    Productivity
    Tasmania
    Total Social Production
    Vital Index
    Youth
    Youth Unemployment

Powered by Create your own unique website with customizable templates.