Yesterday the ABS released their population projections for Australia and the states and territories for the period 2012 to 2101. Under the medium growth scenario (Series B), Australia is projected to double the size of its population to 46 million by 2075, however, under the same medium growth scenario, Tasmania's population is projected to firstly increase slowly before leveling out by around 2046 and then decreasing marginally from 2047 onwards.
While population projections are not intended to be predictions or forecasts (as I have explained in a previous blog), they are illustrations of growth and change in the population that would occur if assumptions made about future demographic trends were to prevail over the projection period.
Population change is a complex process, particularly in Tasmania's case, so I will use this blog to explain (as simply as I can) why Tasmania's population is likely to decline in the future.
The two correlates for population growth are the size of the reproductive cohort[1] and economic performance, neither of which are working in Tasmania's favour at the moment (however, there are early indications that the economy is at a turning point). Both these correlates are influenced by the age profile of inward and outward migrants from interstate and overseas.
Size of Reproductive Cohort
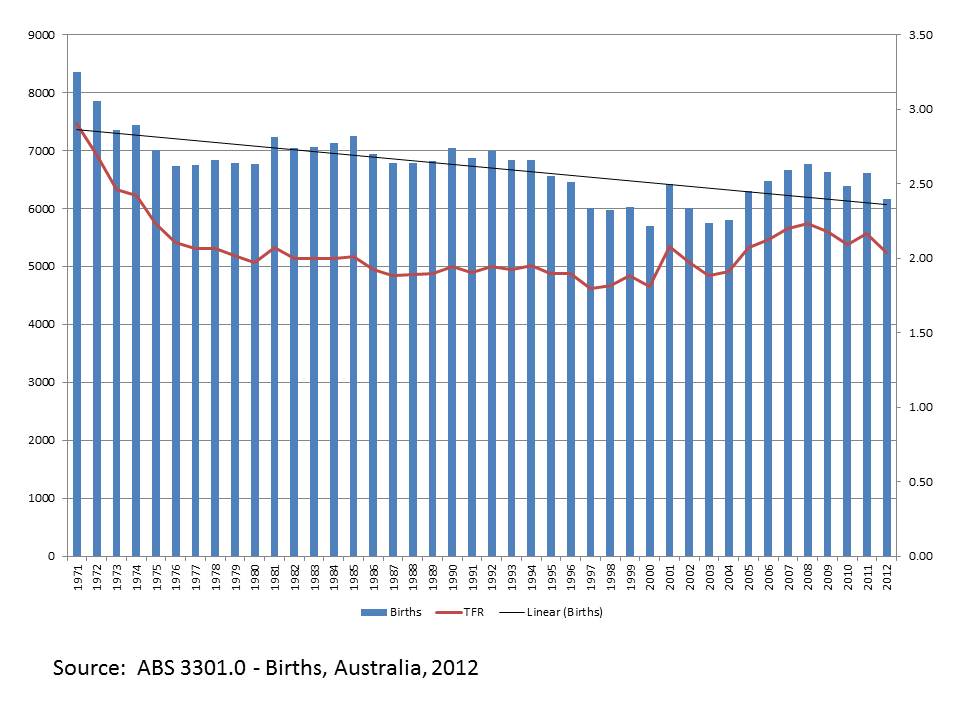
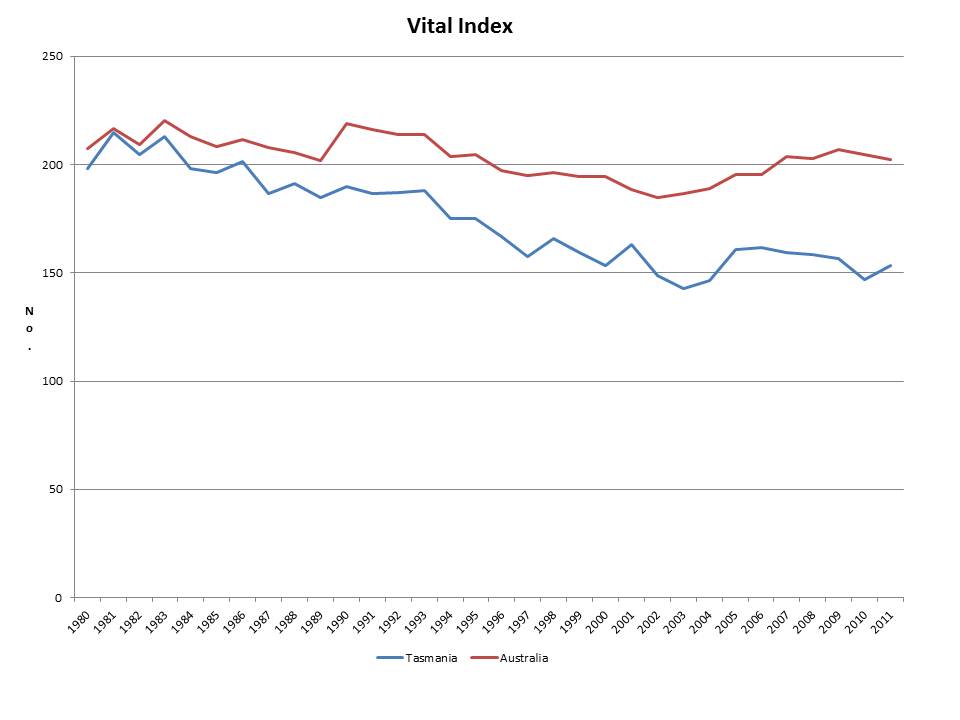
Until 2012, Tasmania had the highest Total Fertility Rate (TFR) in Australia, averaging above the population replacement rate of 2.1 births per woman in her lifetime since 2005. However, it is important to understand that a high TFR does not necessarily automatically translate into an increase in the number of births (see this previous blog). The TFR is a synthetic measure, being the sum of the age-specific fertility rates at a point in time (calculated as the number of births per 1000 women in five year age groups). The TFR does not take into consideration the size of the reproductive cohort (the number of women of childbearing age).
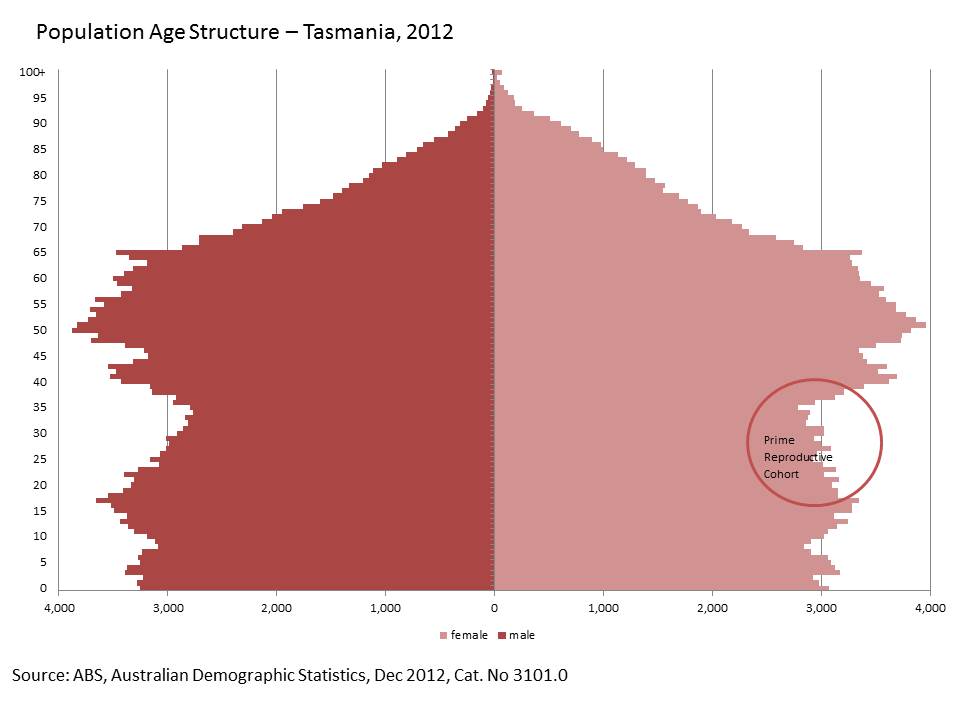
In Tasmania, the size of the reproductive cohort has been declining both numerically and structurally (proportionately) since the largest birth cohort was born in the early 1970s. This decline in the size of the reproductive cohort is influenced by two compounding factors. First, a decline in the TFR (consistent with Australia and other developed nations) which until the early 2000s was persistently below the population replacement rate, and, second, persistent Net Interstate Migration (NIM) losses in the prime reproductive ages.
These factors result in a smaller proportion of women in the population of childbearing age, as reflected in the population age structure (see diagram below). As a result the number of children being born in Tasmania is on a downward trajectory, despite a recent upturn in the early 2000s.
Economic Performance
Popular consensus is that the rate of population growth is influenced by the economic conditions of the state at the time and that a return to positive economic performance will reverse the current downward trajectory of the rate of growth. This is partly true, however, the rate of growth is dependent on the relative economic performance of the state compared with Australia, or even other states.
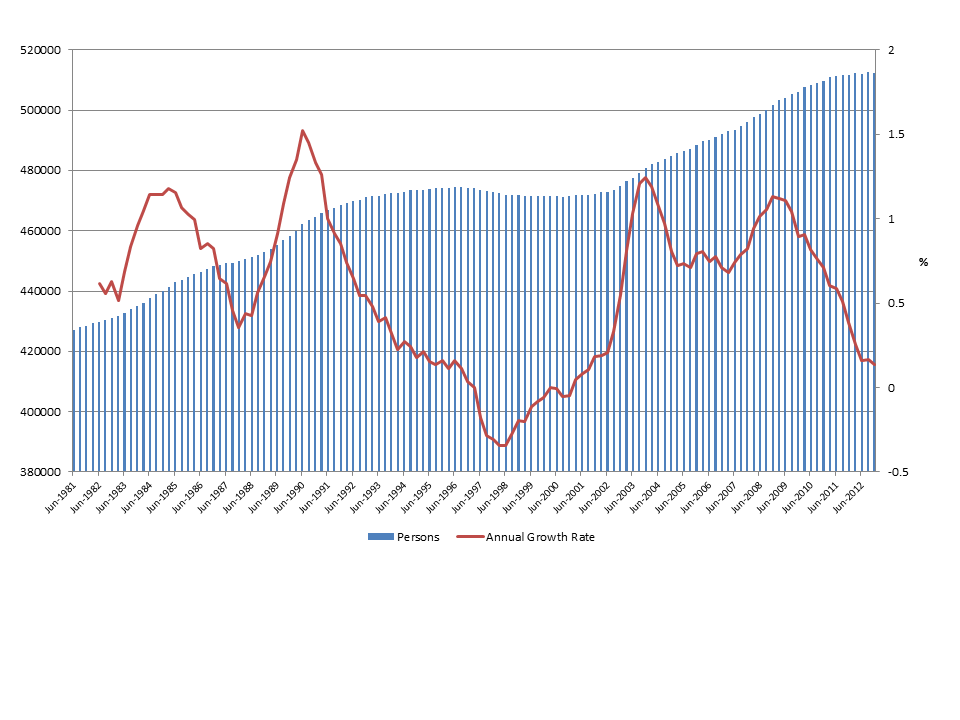
Tasmania’s greatest rates of annual population growth occurred when the state’s economic performance exceeded the national rate, most recently from 2002 to 2004. However, as soon as Australia’s rate of economic growth surpasses that of Tasmania the state’s rate of population growth declines. This is directly attributable to the relative perceived and actual opportunities available elsewhere and resulting NIM losses. As such, in circumstances where Tasmania’s economic performance is not equivalent to other states and/or territories (even if positive), NIM losses in the working and reproducing ages will likely increase, creating the domino effect of decreases in the number of births, and as a result the rate of population growth will decline.
For this reason, a reliance on a return to positive economic growth will not result in a significant reversal in the current rate of population growth in Tasmania. In fact, without intervention, it has the potential to hasten the process to a scenario of population decline. This is attributable to the fact that the organic growth which occurs as a result of positive economic performance is due to (net) growth in older age groups (based on historic trends). So while in the short term, population growth occurs, over the longer term, the resulting acceleration in the rate of ageing will bring forward the point of the end of growth and population decline (as there will be more deaths than births).
Summary
Given that the two correlates for population growth are not working in Tasmania's favour, and are further negatively impacted by the age profile trends of inward and outward migrants (both interstate and overseas), it is unlikely that Tasmania's population will increase over the longer term. Moreover, without a level of strategic intervention, it is likely that Tasmania's population will eventually enter a state of decline.
[1] In terms of calculating the Total Fertility Rate (TFR) the reproductive cohort includes all women aged 15 to 49 years, however when considering potential for population growth the reproductive cohort can be further defined as the ‘prime reproductive cohort’ which is those women aged 20 to 39 years.
While population projections are not intended to be predictions or forecasts (as I have explained in a previous blog), they are illustrations of growth and change in the population that would occur if assumptions made about future demographic trends were to prevail over the projection period.
Population change is a complex process, particularly in Tasmania's case, so I will use this blog to explain (as simply as I can) why Tasmania's population is likely to decline in the future.
The two correlates for population growth are the size of the reproductive cohort[1] and economic performance, neither of which are working in Tasmania's favour at the moment (however, there are early indications that the economy is at a turning point). Both these correlates are influenced by the age profile of inward and outward migrants from interstate and overseas.
Size of Reproductive Cohort
Until 2012, Tasmania had the highest Total Fertility Rate (TFR) in Australia, averaging above the population replacement rate of 2.1 births per woman in her lifetime since 2005. However, it is important to understand that a high TFR does not necessarily automatically translate into an increase in the number of births (see this previous blog). The TFR is a synthetic measure, being the sum of the age-specific fertility rates at a point in time (calculated as the number of births per 1000 women in five year age groups). The TFR does not take into consideration the size of the reproductive cohort (the number of women of childbearing age).
In Tasmania, the size of the reproductive cohort has been declining both numerically and structurally (proportionately) since the largest birth cohort was born in the early 1970s. This decline in the size of the reproductive cohort is influenced by two compounding factors. First, a decline in the TFR (consistent with Australia and other developed nations) which until the early 2000s was persistently below the population replacement rate, and, second, persistent Net Interstate Migration (NIM) losses in the prime reproductive ages.
These factors result in a smaller proportion of women in the population of childbearing age, as reflected in the population age structure (see diagram below). As a result the number of children being born in Tasmania is on a downward trajectory, despite a recent upturn in the early 2000s.
Economic Performance
Popular consensus is that the rate of population growth is influenced by the economic conditions of the state at the time and that a return to positive economic performance will reverse the current downward trajectory of the rate of growth. This is partly true, however, the rate of growth is dependent on the relative economic performance of the state compared with Australia, or even other states.
Tasmania’s greatest rates of annual population growth occurred when the state’s economic performance exceeded the national rate, most recently from 2002 to 2004. However, as soon as Australia’s rate of economic growth surpasses that of Tasmania the state’s rate of population growth declines. This is directly attributable to the relative perceived and actual opportunities available elsewhere and resulting NIM losses. As such, in circumstances where Tasmania’s economic performance is not equivalent to other states and/or territories (even if positive), NIM losses in the working and reproducing ages will likely increase, creating the domino effect of decreases in the number of births, and as a result the rate of population growth will decline.
For this reason, a reliance on a return to positive economic growth will not result in a significant reversal in the current rate of population growth in Tasmania. In fact, without intervention, it has the potential to hasten the process to a scenario of population decline. This is attributable to the fact that the organic growth which occurs as a result of positive economic performance is due to (net) growth in older age groups (based on historic trends). So while in the short term, population growth occurs, over the longer term, the resulting acceleration in the rate of ageing will bring forward the point of the end of growth and population decline (as there will be more deaths than births).
Summary
Given that the two correlates for population growth are not working in Tasmania's favour, and are further negatively impacted by the age profile trends of inward and outward migrants (both interstate and overseas), it is unlikely that Tasmania's population will increase over the longer term. Moreover, without a level of strategic intervention, it is likely that Tasmania's population will eventually enter a state of decline.
[1] In terms of calculating the Total Fertility Rate (TFR) the reproductive cohort includes all women aged 15 to 49 years, however when considering potential for population growth the reproductive cohort can be further defined as the ‘prime reproductive cohort’ which is those women aged 20 to 39 years.