This snapshot provides an insight into the structural change that has occurred in the Tasmanian labour market over the past 12 months, incorporating a pre-pandemic analysis.
Compared with pre-pandemic times, in February 2020, when there were around 261,400 Tasmanians employed, in August 2020, there were 255,300 Tasmanians employed, more than the 248,700 employed in August 2019.
The employment to population ratio was 57.2, down from 58.8 in February 2020, however higher than the 56.4 in August 2019.
The unemployment rate in August 2020 was 6.3% compared with 4.9% in February 2020 and 6.4% in August 2019.
The labour force participation rate was 61.1% in August 2020, compared with 61.8% in February and 60.2% in August 2019.
Around 17,200 were actively looking for work in August 2020, compared with 14,500 in February and 16,900 in August 2019.
Given the JobKeeper payment masks true employment, structural change in the Tasmanian labour market will be analysed using original, hours actually worked data from the ABS Labour Force, Quarterly, Detailed publication released on 25th of September 2020.
This analysis looks at which industry sectors have increased or decreased the hours worked since February 2020 (pre-pandemic times) and August 2019 and how the share of hours worked has changed within the economy.
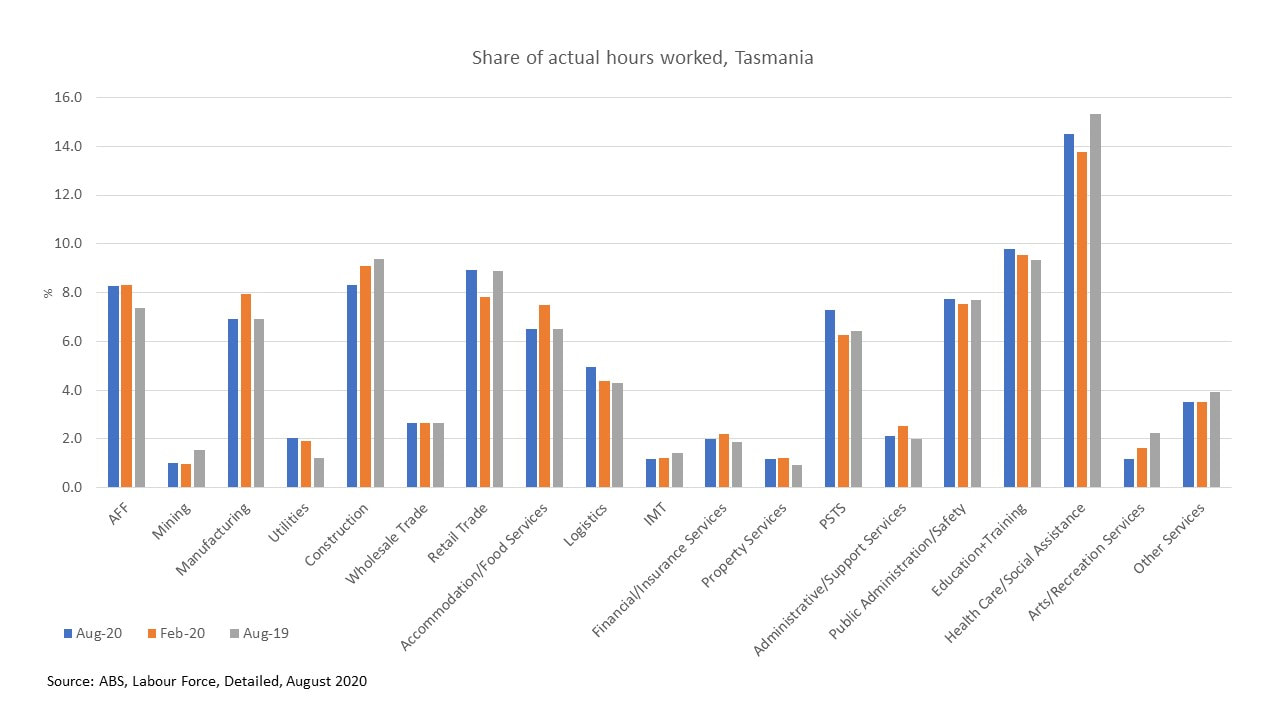
The top five industries for hours worked in August 2020, making up almost have of all hours actually worked (49.8%), were health care and social assistance (14.5 percentage point share), education and training (9.8 PP), retail trade (8.9 PP), construction (8.3 PP) and agriculture, forestry and fishing (8.3 PP).
In February 2020, manufacturing was in the top five industry sectors for hours worked, whereas retail trade was sixth.
Greater structural change in the economy is evident when compared with August 2019 when health care and social assistance, construction, education and training, retail trade and public administration and safety were the top five industries for hours actually worked.
Compared with pre-pandemic times, in February 2020, when there were around 261,400 Tasmanians employed, in August 2020, there were 255,300 Tasmanians employed, more than the 248,700 employed in August 2019.
The employment to population ratio was 57.2, down from 58.8 in February 2020, however higher than the 56.4 in August 2019.
The unemployment rate in August 2020 was 6.3% compared with 4.9% in February 2020 and 6.4% in August 2019.
The labour force participation rate was 61.1% in August 2020, compared with 61.8% in February and 60.2% in August 2019.
Around 17,200 were actively looking for work in August 2020, compared with 14,500 in February and 16,900 in August 2019.
Given the JobKeeper payment masks true employment, structural change in the Tasmanian labour market will be analysed using original, hours actually worked data from the ABS Labour Force, Quarterly, Detailed publication released on 25th of September 2020.
This analysis looks at which industry sectors have increased or decreased the hours worked since February 2020 (pre-pandemic times) and August 2019 and how the share of hours worked has changed within the economy.
The top five industries for hours worked in August 2020, making up almost have of all hours actually worked (49.8%), were health care and social assistance (14.5 percentage point share), education and training (9.8 PP), retail trade (8.9 PP), construction (8.3 PP) and agriculture, forestry and fishing (8.3 PP).
In February 2020, manufacturing was in the top five industry sectors for hours worked, whereas retail trade was sixth.
Greater structural change in the economy is evident when compared with August 2019 when health care and social assistance, construction, education and training, retail trade and public administration and safety were the top five industries for hours actually worked.
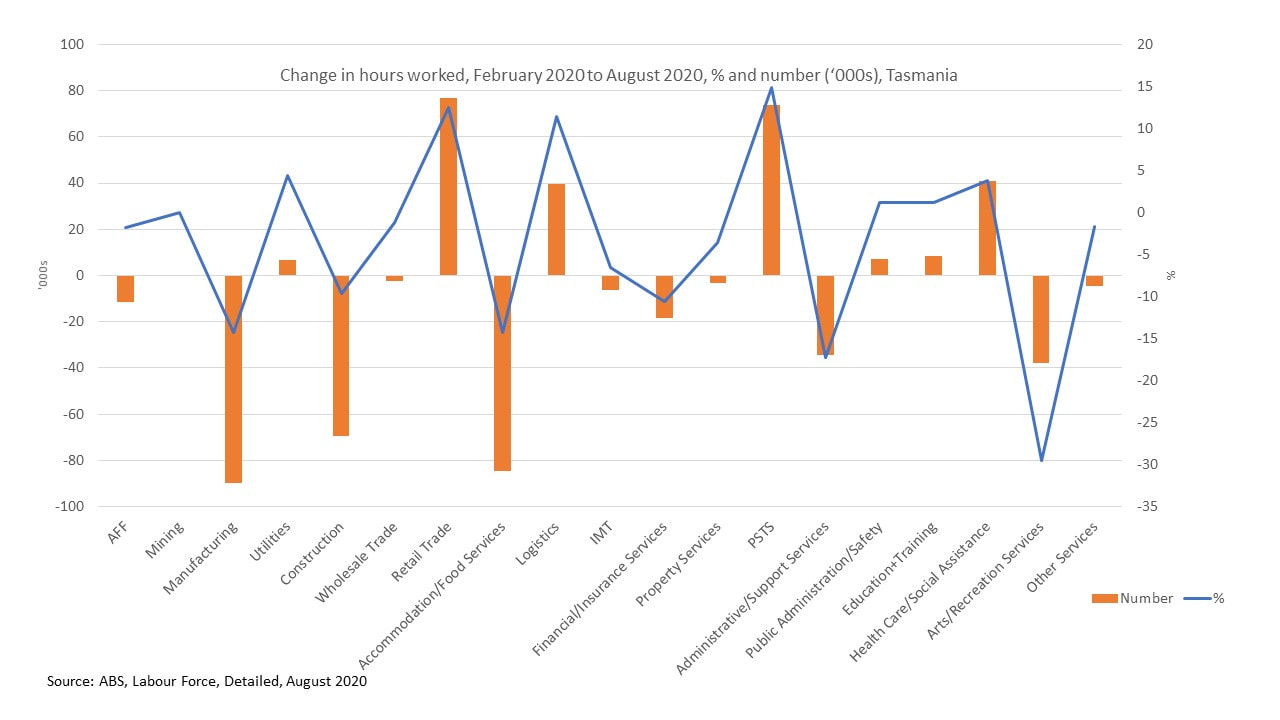
Compared with pre-pandemic times, Tasmanians worked 1.4% less hours in August 2020 than in February 2020. Tasmanians worked more hours in seven industries compared with pre-pandemic times; professional, scientific and technical services (14.9%), retail trade (12.4%), logistics (11.4%), utilities (4.4%), health care and social assistance (3.8%), public administration and safety (1.2%) and education and training (1.1%).
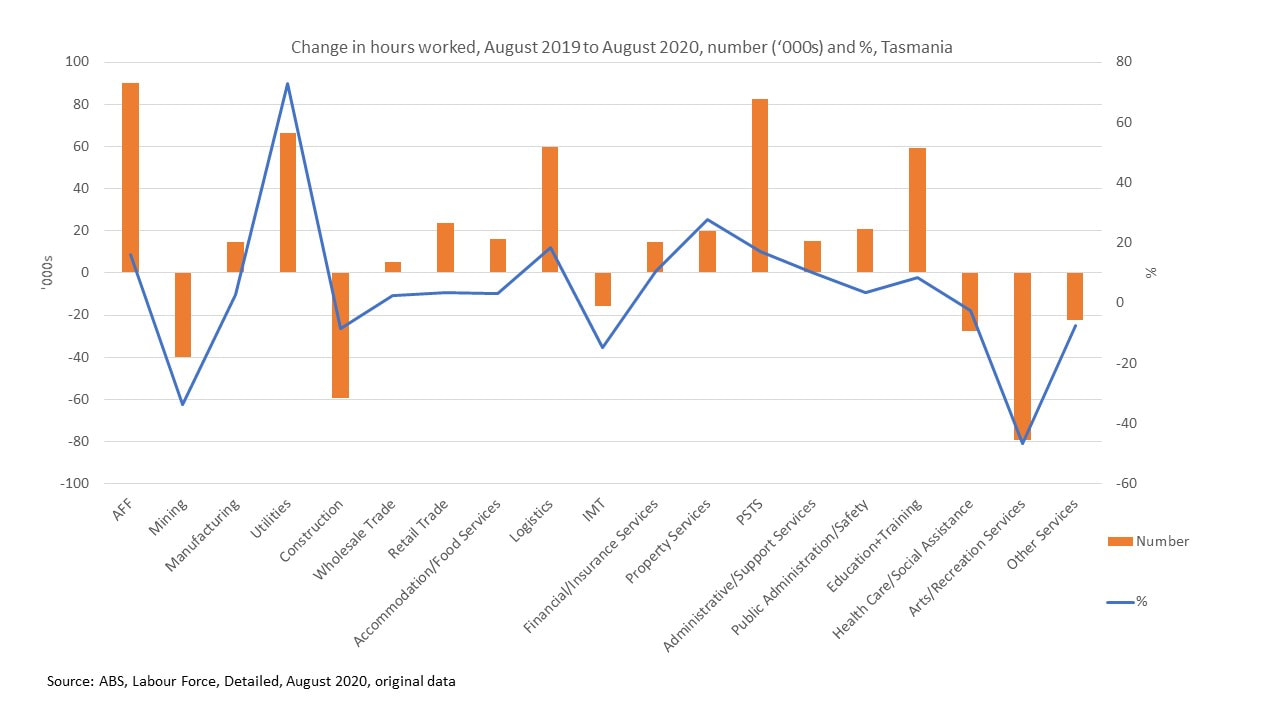
Compared with 12 months ago, Tasmanians worked 3.2% more hours in August 2020. All industries recorded more worked hours except for arts and recreation services (-46.6%), mining (-33.8%), information media and telecommunications (-14.6%), other services (-7.6%) and health care and social assistance (-2.4%).
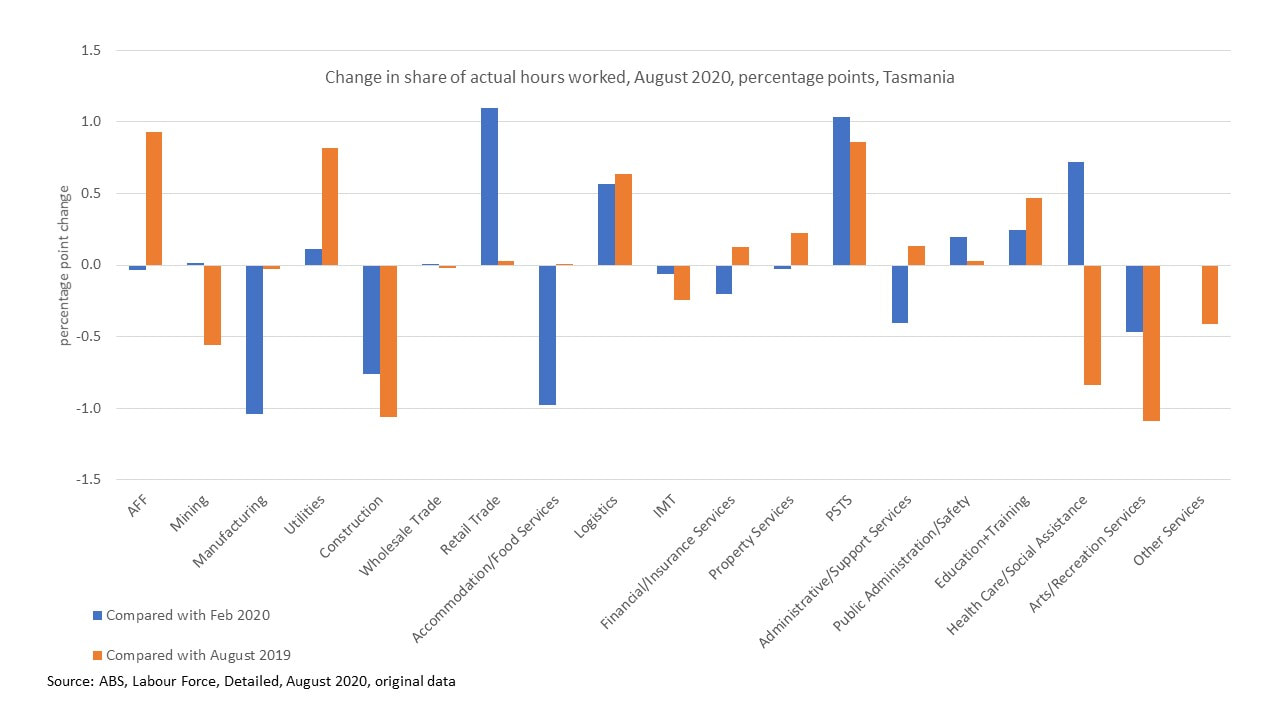
In terms of the share of hours actually worked for the total Tasmanian economy since February 2020 (pre-pandemic) the greatest increase in the share of hours actually worked was in retail trade (1.1 percentage point increase in the share of hours worked) followed by professional, scientific and technical services (1.0 PP), healthcare and social assistance (0.7 PP) and logistics (0.6 PP). These gains in share of hours worked were offset by a decline in the share of hours worked in the accommodation and food services sector (-1.0 PP), construction (-0.8 PP), arts and recreation services (-0.5 PP) and administrative and support services (-0.4 PP).
The structural change in the economy is vastly different over the 12 month period when compared with August 2019. Over 12 months, the economy saw a shift to agriculture, forestry and fishing (0.9 PP), professional, scientific and technical services (0.9 PP), utilities (0.8 PP), logistics (0.6 PP) and education and training (0.5 PP). This shift was offset by declines in the share of the hours worked in construction (-1.1 PP), arts and recreation services (-1.1 PP), healthcare and social assistance (-0.8 PP) and mining (-0.6 PP). The share of the hours worked had no change for manufacturing, wholesale trade, retail trade, accommodation and food services and public administration and safety.
The structural change in the economy is vastly different over the 12 month period when compared with August 2019. Over 12 months, the economy saw a shift to agriculture, forestry and fishing (0.9 PP), professional, scientific and technical services (0.9 PP), utilities (0.8 PP), logistics (0.6 PP) and education and training (0.5 PP). This shift was offset by declines in the share of the hours worked in construction (-1.1 PP), arts and recreation services (-1.1 PP), healthcare and social assistance (-0.8 PP) and mining (-0.6 PP). The share of the hours worked had no change for manufacturing, wholesale trade, retail trade, accommodation and food services and public administration and safety.
This analysis points to an increase in spending and/or discretionary income over the six months since February 2020, being realised by, or redirected to, the retail trade and associated logistics sector, from the accommodation and food services, construction and arts and recreation sectors, as well as an understandable increase in health care and social assistance during the pandemic period. It raises the question of what the impact of the reduction of the JobKeeper and JobSeeker payments on employment and hours worked will be into the future, at least over the short term.
However, when compared with 12 months ago, prior to the pandemic, the change in the share of hours actually worked shifted to sectors which are predominantly trade/market sectors (agriculture, forestry and fishing) and higher skilled (professional, scientific and technical services, as well as utilities and education and training), indicating a positive structural shift which may result in employed people working more hours for higher levels of income, which can then be distributed as discretionary income in the wider economy. change in the professional, scientific and technical services sector is also a leading indictor for change in the construction sector, suggesting that increases in the hours worked in the construction sector is possible in the short term.
The decline in both the number of hours worked, as well as the share, in health care and social assistance is both surprising and concerning given the impact of the pandemic on our health and well-being as well as the pressure the Tasmanian health system was under prior to the pandemic and the need to ensure the state is prepared for COVID-19 outbreaks into the future.
