Given the level of interest and the response I have received to the Talking Point I wrote for the Mercury on 8 August 2022 in relation to Tasmania’s population strategy, I have put together a brief addendum to provide a more technical explanation and visual representation of the change in Tasmania’s population age structure since the last ABS Census of Population and Housing (not possible in the printed form of a newspaper).
After each Census the ABS ‘rebases’ the Estimated Resident Population (ERP) for Australia and its regions and other statistical areas. This is because the Census provides an actual count of Australia’s population whereas ERP between Censuses is estimated based on the collection of administrative data – births, deaths and migration (I explain the implications of using administrative data for interstate migration in this blog). Each quarter these estimates are added to the previous population stock estimate. The ERP includes all people who usually live in Australia (regardless of nationality, citizenship or visa status).
The ABS has released the preliminary rebased ERP for June 2021 with the final rebased ERP due to be released in June 2023. Read more about the rebasing process here.
The rebasing of Tasmania’s ERP has revealed a dramatic change in the population age structure in a very short period of time – from 2016 to 2021 - which is difficult to reconcile at the moment. Further analysis of ABS Census migration data (place usual of residence – PUR) one year prior and five years prior to the Census) should provide greater insight when the data becomes available from October this year.
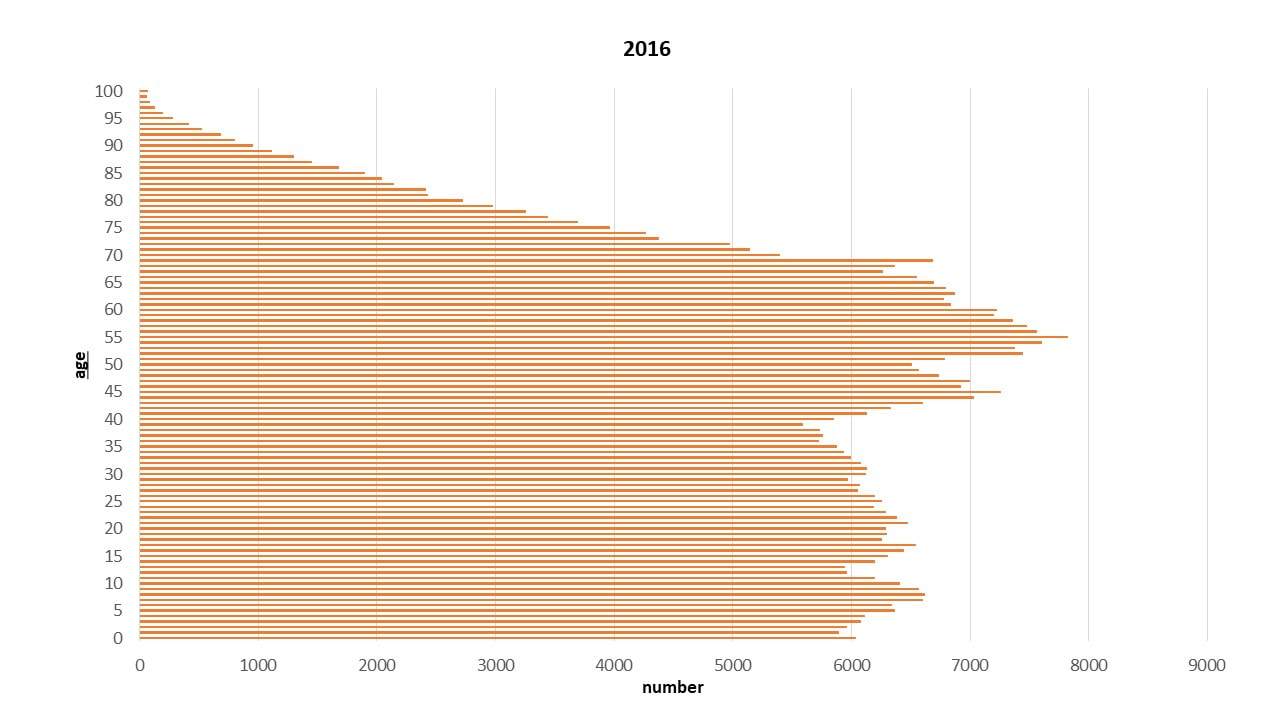
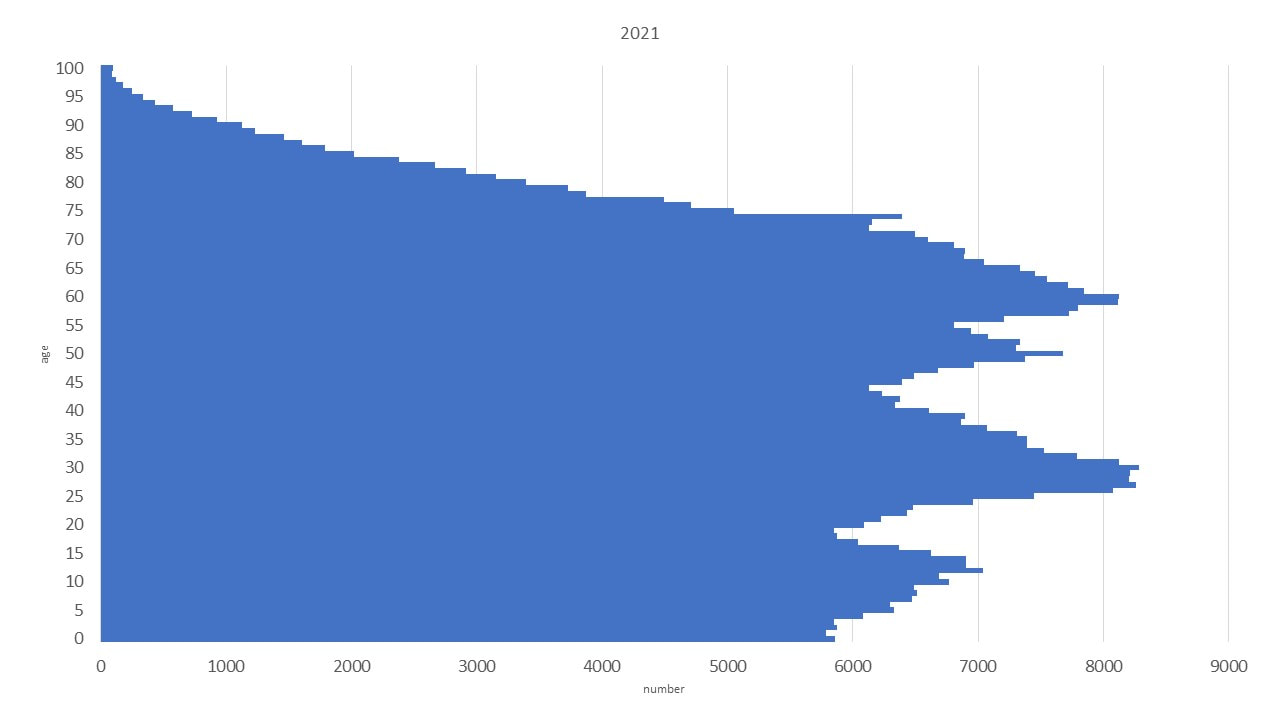
The first figure below shows Tasmania’s population age structure in 2016 (orange) and the second shows the rebased population age structure for 2021 (blue). As is visually evident, they are very different population age structures.
In 2016, Tasmania’s population age structure represented a rapidly ageing population, with the large baby boomer cohort progressively getting older, the working age population diminishing in size reflecting the age profile of interstate migration movements, and a smaller cohort of children reflecting both the decline in the size of the reproductive cohort (women aged 15 to 49 technically) and the lower than replacement rate TFR (total fertility rate).
After each Census the ABS ‘rebases’ the Estimated Resident Population (ERP) for Australia and its regions and other statistical areas. This is because the Census provides an actual count of Australia’s population whereas ERP between Censuses is estimated based on the collection of administrative data – births, deaths and migration (I explain the implications of using administrative data for interstate migration in this blog). Each quarter these estimates are added to the previous population stock estimate. The ERP includes all people who usually live in Australia (regardless of nationality, citizenship or visa status).
The ABS has released the preliminary rebased ERP for June 2021 with the final rebased ERP due to be released in June 2023. Read more about the rebasing process here.
The rebasing of Tasmania’s ERP has revealed a dramatic change in the population age structure in a very short period of time – from 2016 to 2021 - which is difficult to reconcile at the moment. Further analysis of ABS Census migration data (place usual of residence – PUR) one year prior and five years prior to the Census) should provide greater insight when the data becomes available from October this year.
The first figure below shows Tasmania’s population age structure in 2016 (orange) and the second shows the rebased population age structure for 2021 (blue). As is visually evident, they are very different population age structures.
In 2016, Tasmania’s population age structure represented a rapidly ageing population, with the large baby boomer cohort progressively getting older, the working age population diminishing in size reflecting the age profile of interstate migration movements, and a smaller cohort of children reflecting both the decline in the size of the reproductive cohort (women aged 15 to 49 technically) and the lower than replacement rate TFR (total fertility rate).
By 2021, a bulge has appeared in the 25-to-39-year age groups. From the perspective of sustaining the population, this is a welcome change contributing to the prime working age groups and also reproducing age groups. However, the extent of the rebased change is somewhat unexplained (as yet). We know that there had been a reversal in the historic interest migration trends for these age groups for the few years prior to 2019, as I discuss in this blog and this one, however, these interstate migration changes should have been captured in the quarterly ERP releases. These blogs also highlight the decline in arrivals to Tasmania and increase in departures from Tasmania which started occurring prior to the pandemic. Therefore, it is hard to reconcile the changes in the rebased age structure based on interstate migration movements. Overseas migration to Tasmania was previously dominated by international students, and while smaller in number than total interstate migration movements, they would certainly make a considerable contribution to the bulge (if they had stayed in Tasmania during the pandemic). All of these are factors we will be able to explore further once the 2021 Census data is released (and in a format we can analysis it in!).
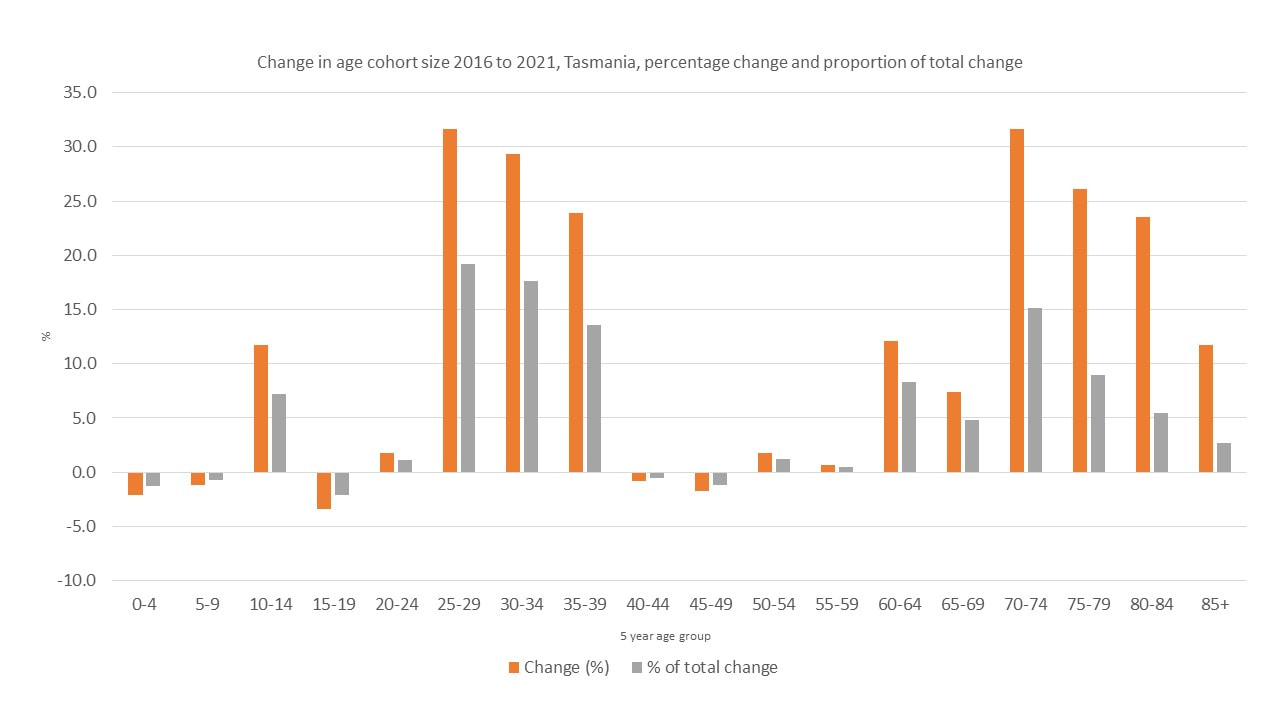
The below chart shows the percentage change in the size of the age cohort between 2016 and 2021 (orange columns) and the grey column shows the proportion of the total population change (50,400 additional people) attributable to the respective age group.
As is evident, the size of the 25- to 39-year-old age groups increased significantly in the five-year period (over 30% for those aged 29 to 29) which can not be explained by the size of the age group in the previous five-year period and can only be explained by migration – interstate and overseas. The size of the 70- to 84-year-old age groups also increased considerably which can be explained by a number of factors; the size of the age group in the previous five-year period, increased longevity and migration. The increase in the 25- to 39-year-old age group represented a greater proportion of overall population change than the 70-to-84-year age group with almost 1 in 5 of the additional Tasmania being aged between 25 and 29 years (all of whom need somewhere to live).
At the other end of the spectrum, there are now less people in Tasmania aged between 0 and 9, 15 to 19 and 40 to 49 years of age than in 2016.
These changes in Tasmania’s population age structure have implications for our infrastructure and services needs which need to be planned for, in particular – health, education and housing, notwithstanding the regional differences in population change not discussed here.
NB. Important to note that the ABS has released preliminary rebased ERP data only, the final rebased ERP will be released in June 2023.
NB. Important to note that the ABS has released preliminary rebased ERP data only, the final rebased ERP will be released in June 2023.
